From left to right: Michael Hewlett, David Robinson, Mark Tovey, and Erica Robinson
Brianna Smrke has been working with the simulation team at SiG@Waterloo. She blogged about our Sudbury simulation intensiveat downwithvowels. We’ll be reposting her first-person accounts of those sessions, plus impressions of her current trip to India to visit the OaSiS Social Innovations Laboratory in Bhopal.
Many people have seen Hans Rosling’s original TED talk about GapMinder, Stats that reshape your worldview (below). It is, after all, one of the most popular talks on TED of all time. Hans Rosling’s TED Talks have very effectively introduced the idea of visualization to a popular audience. One of the things that we will be exploring in this blog is the difference between visualization and simulation, and how these technologies can be used to explore social innovation.
Rosling also hosted a one-hour documentary, The Joy of Stats. This was broadcast by the BBC in 2010, and is viewable online in full.
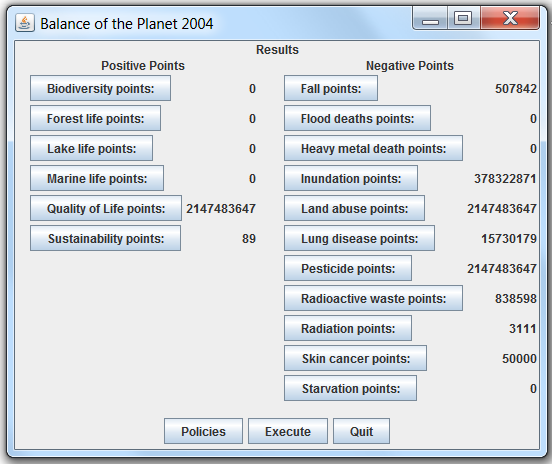
We have been evaluating policy simulation games, both for design ideas, and for a sense of whether they might be useful for real world policy processes. Balance of the Planet is supposed to allow players to understand problems of a global nature, but is still under development.
Over the summer, Social Innovation Simulation will be posting a series of technical tutorials designed to acquaint those interested with some of the technologies we’re working with.
This tutorial describes how you can use a data visualization library called D3 (“Data Driven Documents”). D3 provides tools to manipulate data and display it. D3 is useful when you have lots of data and you want to present it to others in a way that will make it easy for them to quickly understand since it provides easy ways of making visual representations of data.
In December 2012, members of our team went to Sudbury to work with a group of people interested in how Northern Ontario might be affected by a transportation spine to the Ring of Fire.
The prototypes we were able to develop during the 3-day intensive allowed us to test models that have a high-degree of interactivity, whereby users can easily change variables and see how the changes might play out.
Steve Williams discusses the Northern Ontario Mining Impact model he developed, in consultation with economist David Robinson.
This model shows the population, local economic impact and social impacts of proposed mines in Northern Ontario. You can change variables such as the density of mines (i.e., number of mines per 100km2) and number of employees per mine. The model shows that under reasonable assumptions of mine density, the population increase in the region will be dramatic. The model allows for the impact of worker families and support workers on the total population increase. You can also model the economic impacts by making assumptions on the proportion of salaries that are spent locally along with the proportion of local outsourcing by the mine sites themselves.
In December 2012, members of our team went to Sudbury to work with a group of people interested in how Northern Ontario might be affected by a transportation spine to the Ring of Fire.
The prototypes we were able to develop during the 3-day intensive allowed us to test models that have a high-degree of interactivity, whereby users can easily change variables and see how the changes might play out.
Steve Williams narrates this introduction to the Northern Ontario Demographic and Income Trend Model he developed for the simulation project, in consultation with economist David Robinson.
David Robinson: Here we model the case if things proceed as they have previously in Canada. The federal government and provincial governments are all trying to avoid this simple case. It’s relatively simple to extend this model to account for some more sophisticated policies intended to let local first-nations people use these developments.